
Does a Full Calendar Mean Less Courtesy? The Impact of Meeting Culture
When most people consider a day at work, the first thing that comes to mind is their meetings. When do I have meetings today? Which of these meetings is going to be useful, and which will be long and boring? Will I have time to eat between meetings today?
In a recent study, we examined the well-being of remote, in-person, and hybrid workers compared to a year ago. We found that 39 percent of workers are spending more time in meetings than last year. Even those that are spending less time at work overall are spending more of it in meetings. And it’s worse for remote and hybrid workers: 50 percent of them say their total meeting time has increased.
So what’s the impact of all this meeting time? For a start, our survey revealed that employees whose meeting load increased over the past year are 33% more likely to be physically exhausted and 24% more likely to be mentally exhausted at the end of the work day than those whose time in meetings has remained the same or decreased.
But we wanted to go deeper.
Thanks to the Cultivate AI-powered coaching platform that joined our Perceptyx family in February, we’re able to capture unique calendar data and dig into the context of that data more deeply than other products can. We wanted to share some of the most interesting insights about the impact of meetings.
Meeting Culture Today
First, we needed to understand what the average company meeting culture looks like. We created a standard calendar across ten weeks for each user. That allowed us to understand what an average week looks like for any given person and calculate weekly measures like hours in meetings, focus time, predictability, and meetings by day of the week. We removed meetings with fewer than 2 participants (usually appointments or individual tasks), meetings greater than 3 hours long (often out-of-office notices or one-time full-day events), and meetings a user either declined or did not respond to. This resulted in a heat map calendar that mimicked a user’s standard week.
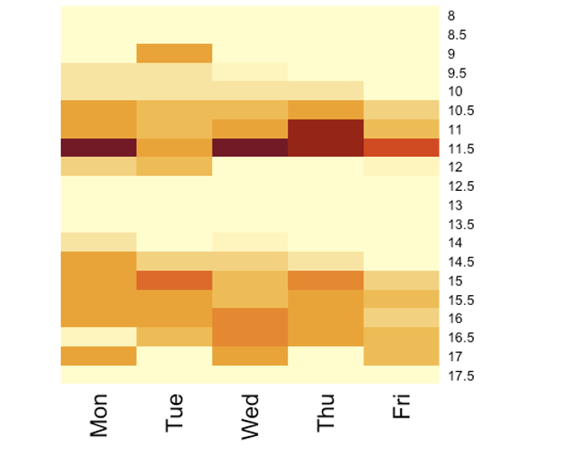
Below you can see a sample calendar for someone who has pretty reliable meetings on Mondays from 11 am-12:30 pm and some early meetings on Tuesday and Fridays. The rest of their meetings seem to vary week to week.

Conversely, this user has many weekly meetings that seem to recur with a couple of hours free over lunchtime. Their weekly schedule is more predictable than the example above and has more dedicated focus time as well.
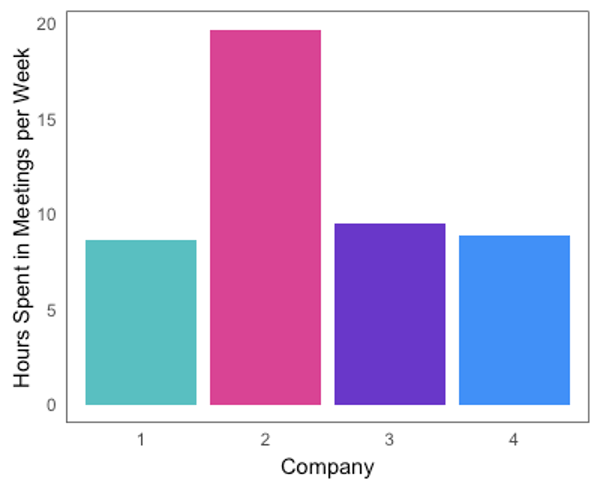
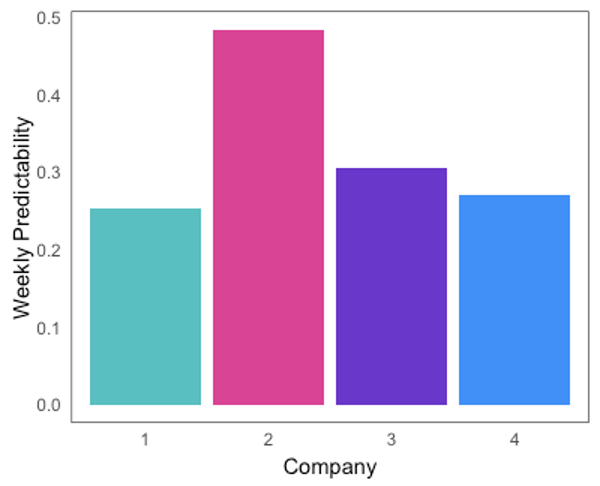
Once we had individual calendar predictions, we were able to calculate metrics at a company-wide level. We were interested generally in how long people spend in meetings each week, how predictable their schedules were from week to week, and how many focus hours (blocks of two hours or greater without meetings) people had per week. We were also curious how those metrics varied by company. Below you can see the results of that analysis.
In general, it looks like people spend about a quarter of their time on a weekly basis in meetings. However, at Company 2, that number rises to nearly half! These companies obviously have different cultures around meeting use.
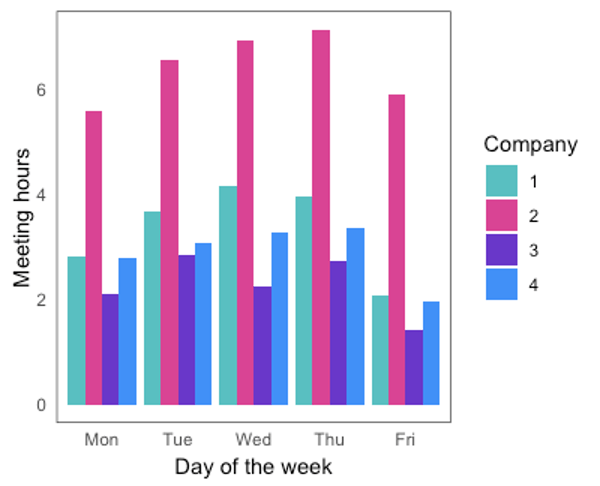
We can also look at meetings by day of the week. Company 2 still has vastly more meetings than the rest of the companies in this analysis, but you can see that all four of our companies hold most of their meetings in the middle of the week, leaving Monday and Friday for catching up from the weekend and preparing for the weekend.
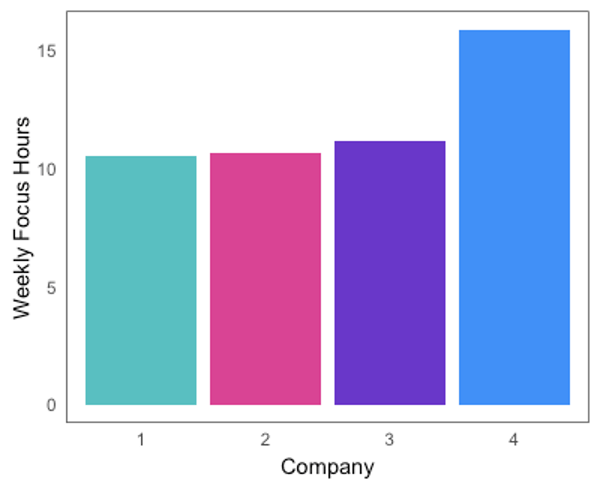
The next interesting metric is focus time. How concentrated are meetings throughout the day? Can people focus on work between meetings, or are they constantly in and out of meetings and preparing for the next? We know company 2 holds the most meetings, so we might expect them to have the least focus time, but that’s not what we found. Instead, it seems like they are able to at least stack their meetings in such a way that they have similar focus time to our other companies. But Company 4 does the best job of that, allowing an average of 15 uninterrupted hours per week.
Finally, we wanted to see how predictable a user’s week is from company to company. That looks at whether meetings are usually more recurring or more ad hoc. We can calculate predictability by using the average workweek, which gives us a probability of meetings at any given time. For instance, if a certain time block has a probability of 0.8, that means the user has a meeting at that time in 8 of the 10 weeks we analyzed. Conversely, if a user has a lot of blocks with 0.2 or 0.3 probabilities, they only have meetings 2 or 3 of those weeks at those times, which means their schedule is less predictable. We can average these probabilities to create a predictability measure.
Predictability allows people to schedule their work around their meetings more easily and should lead to greater productivity. This tracks pretty closely with meeting hours in general, but it’s good to know that despite having twice as many meetings, Company 2 is able to at least keep weeks very predictable for their employees.
These metrics are a great starting point to analyze company meeting culture. Next we needed to analyze how each of these variables impacts digital behavior, which can give us greater insight into how meeting hygiene impacts productivity and digital culture on a company by company basis.
Understanding the Impact of Meeting Culture
Our next step was to explore how the variables we calculated using calendar data correlate to digital behaviors. This analysis can help us understand the impact of various meeting cultures and help develop best practices around calendaring. This analysis covers anonymous data from 522 managers at 6 different companies, so it gives a broad overview of the relationship between calendars and digital behaviors, but it does not capture any specific company culture.
We focused on three variables:
- Percent of time spent in meetings. The percent of work hours per week that a user spends in meetings.
- Weekly focus hours. The number of hours without meetings, that are in blocks of at least two hours, to allow a user to get focused work done.
- Predictability. How much a user’s calendar varies from week to week, measured from 0 (no repeating meetings) to 1 (every week looks exactly the same from a meeting standpoint).
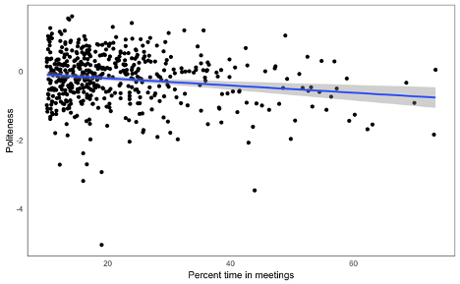
For percent of time in meetings, we found a negative correlation with politeness. In other words, the more time people spend in meetings, the less polite they are to the people around them.
Further, we found that it takes longer for people to respond to requests the more time they spend in meetings.
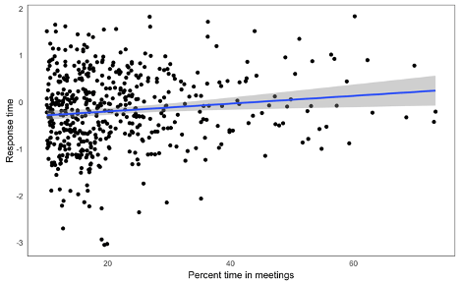
Thus, managers are able to respond to requests more quickly and communicate more politely when they spend less time per week in meetings.
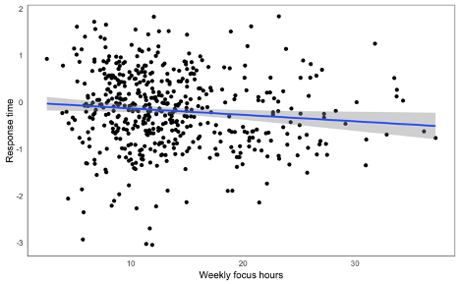
We also see an impact of focus hours on response time. The more focus time a manager has, the more quickly they respond to their direct reports.
They also have a greater response density, which suggests that their responses are more richly detailed and contain more information.
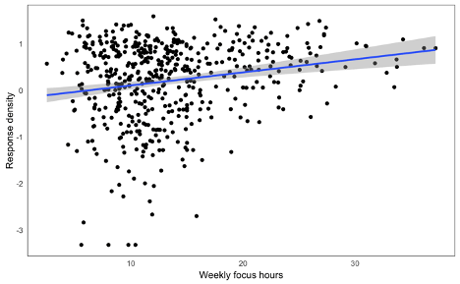
The more focus hours a manager has, the more responsive they are to their direct reports.
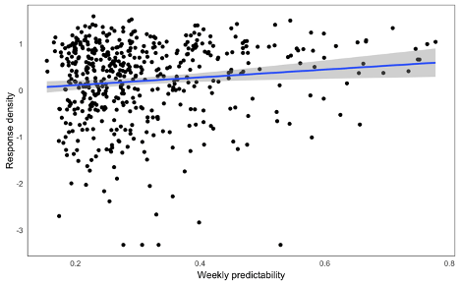
There also seems to be a benefit to calendar predictability from week to week. As with focus hours, more predictable weeks allow managers to respond to their direct reports with more thought and more information.
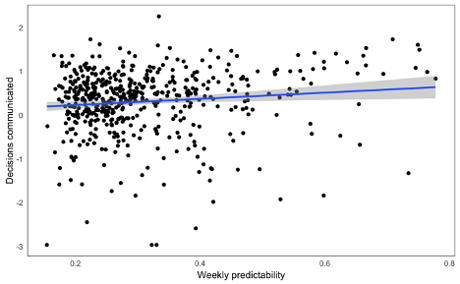
Confirming that deduction, we see more instances of managers communicating specific events to their direct reports, in this case informing them of decisions they have made.
Taken together, this data suggests that managers can operate more effectively when they spend less of their time in meetings, have greater blocks of focus time, and have predictability in their schedules from week to week. None of this is particularly surprising. If someone has fewer meetings, of course, they can respond more quickly to their direct reports. It tracks that more meetings would also lead to fatigue or crankiness, which can then be seen in how politely someone communicates. Focus time allows managers more time to compose thoughtful responses to queries from their team. And having a more predictable week allows you to communicate more thoroughly as well since you are not as distracted by lots of new meetings.
While we cannot assume causality from this analysis, these correlations encourage further exploration into calendar data as a means of improving communication between managers and their direct reports.
But consider this alongside a key data point from our aforementioned study comparing worker well-being in 2022 and 2021: the more senior the employee, the heavier the meeting burden has grown. While 1 in 4 individual contributors say their meeting time has increased in the past year, 3 in 5 director-level employees say the same.
The takeaway: the pandemic has pushed senior managers into more meetings and, based on the correlations above, made them more distracted and less communicative.
All of which is to say, as we reimagine the future of work, perhaps we should not only consider where people spend their time physically but also how they’re spending it - and whether all those meetings really make good sense.